
COVID-19 DAILY DASHBOARD
ISSUE #10: MARCH 31, 2020
Scorecard


Selected Graphics
Many countries exhibit a consistent time-based downward pattern in the rate of daily changes in COVID-19 infection cases. This pattern seems to have delayed by nearly three weeks in the U.S., as testing ramped and the virus spread across the country.


How to show an exponentially-growing process . . .and to visualize when this exponential growth ceases. Note the similar linear pattern in the data for each country represented . . .and, when the peak virus spread occurred in China and South Korea:

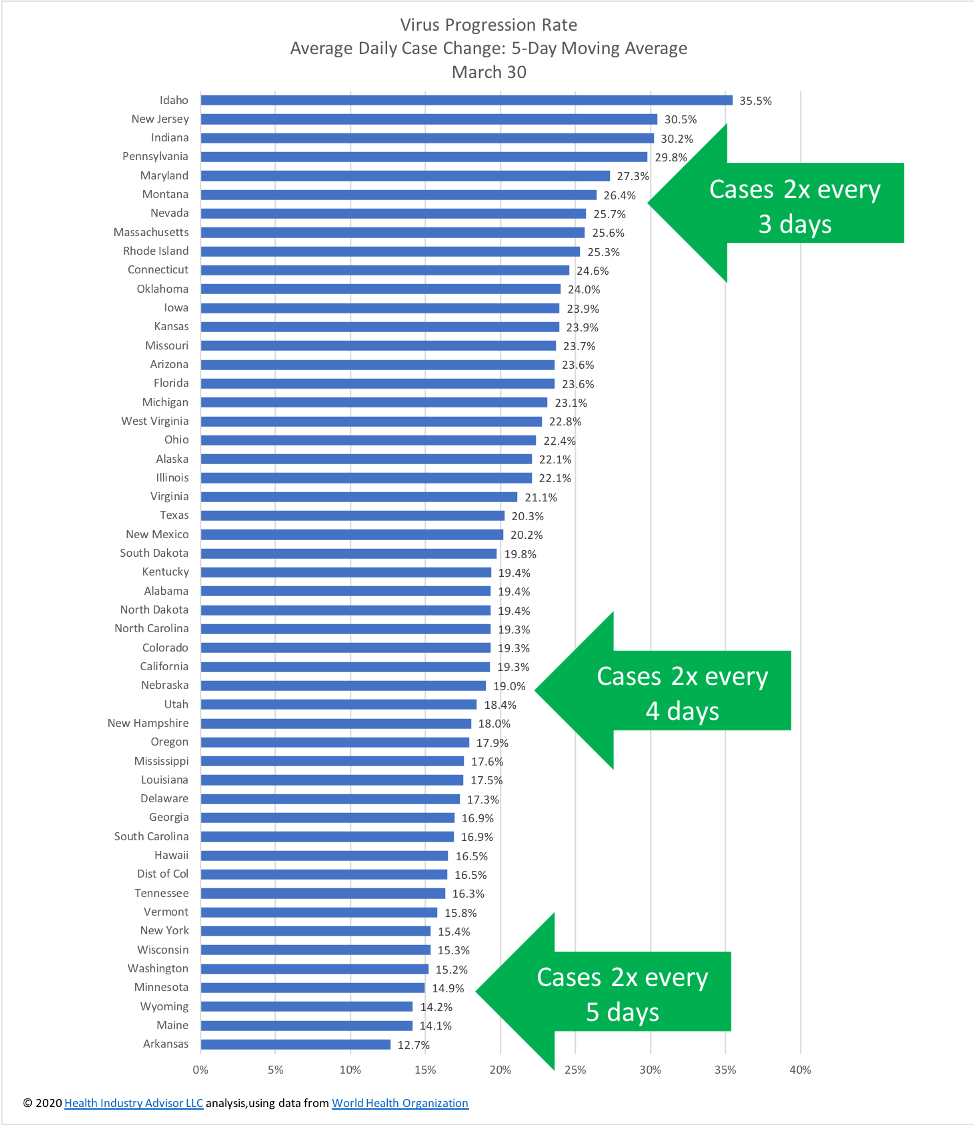
The spread of the virus has varied across the country. Also, each state's pace at which the virus is spreading is different, as depicted in this graph. Note: these rates will naturally decline and, in many cases already are declining. For example, on March 20, New York was experiencing a doubling of cases every 2 days; by March 27, it was doubling every 3 days; now, its doubling every 4 days.
No comments:
Post a Comment